Using Intellij IDEA to write and debug Erlang code
February 2015.


Written 2015-02-02.
Requirements
My system is a Windows 8.1 (6.3 build 9600).
Download IntelliJ IDEA from JetBrains (I use the Community Edition, currently ideaIC-14.0.3.exe).
My installed erlang is:
Erlang/OTP 17 [erts-6.2] [64-bit] [smp:8:8] [async-threads:10]
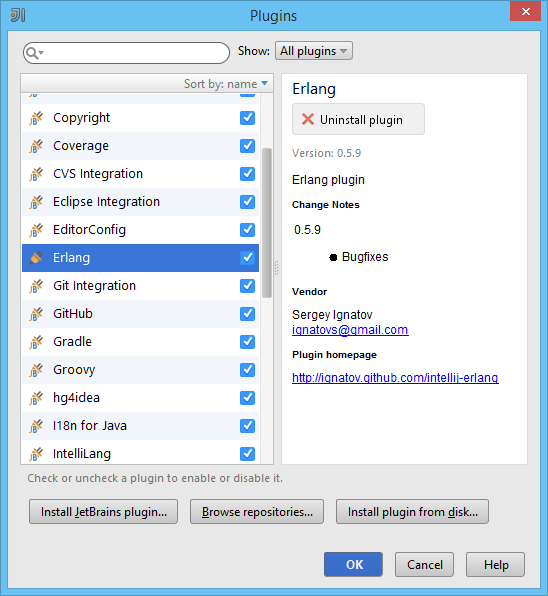
Start IDEA, and go the plugin page (click "Configure"). Install the very nice Erlang plugin (currently ver 0.5.9 (2014-11-18)).
Install rebar somewhere on your system (clone the repository and run bootstrap.bat with the erlang binaries in your PATH).
Configure the IDE
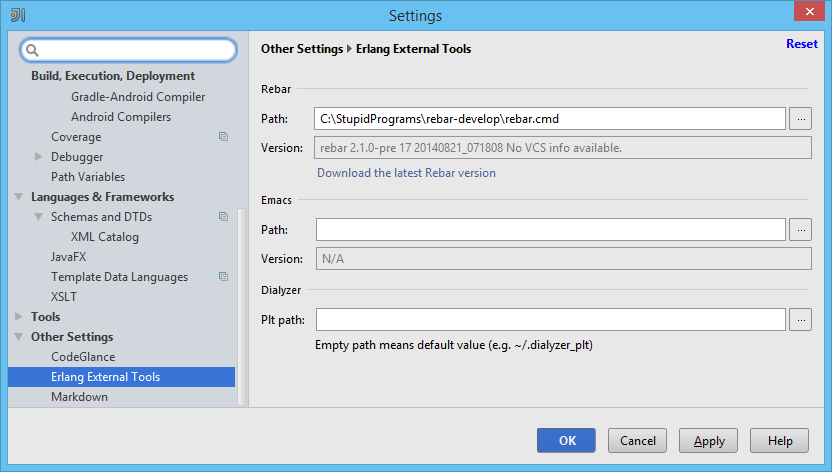
In the IDE's settings window, go to "Other Settings / Erlang External Tools" and input the location of your rebar binaries.
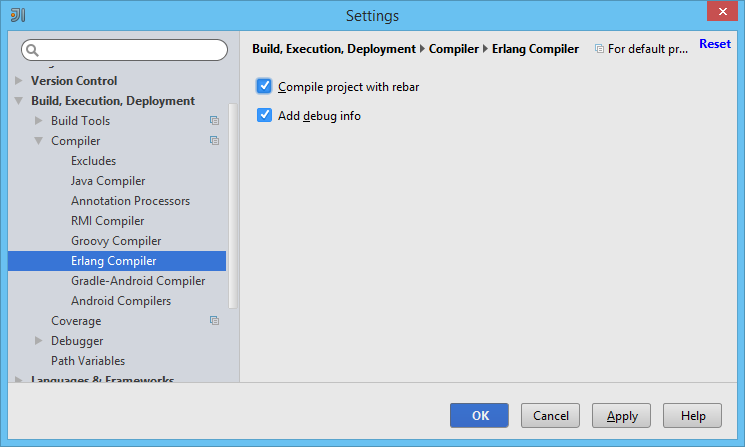
In "Build, Execution, Deployment/Erlan Compiler", check "Compile project with rebar".
Create a new project, and select Erlang. Leave "Additional Libraries and Frameworks" empty and click Next.
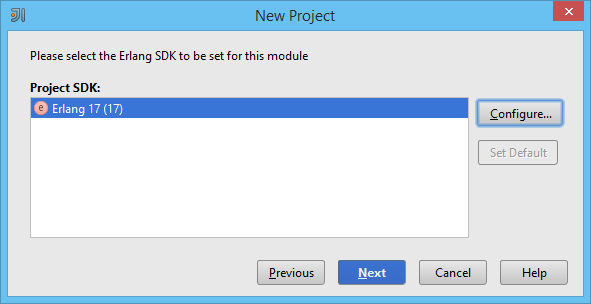
Click on "Configure" and input the location of your Erlang SDK (exemple: "C:\Program Files\erl6.2").
If you did well, the SDK is recognized correctly.
Debugging a simple file
Let's create a simple Erlang code and try to debug it.
Add a file, input some code, and click "Build / Make".
If your code is incorrect, the list of warnings and errors appears, and you can double click on the items to go directly to the source of error (like in any good IDE).
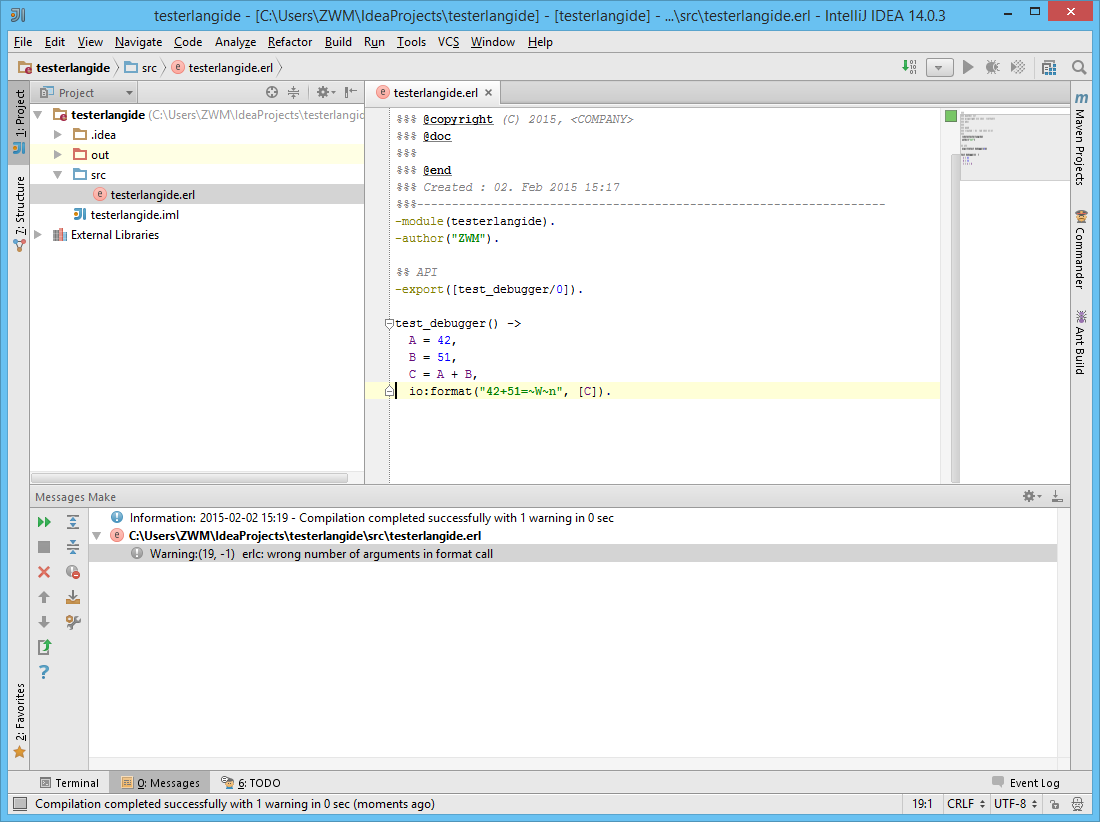
If your code is correct, the project is compiled.
A simple default debug configuration is created. You can put a breakpoint in your code and debug it.
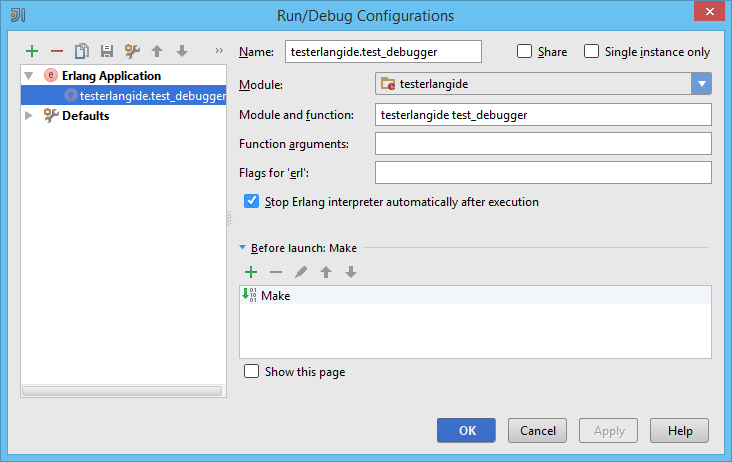
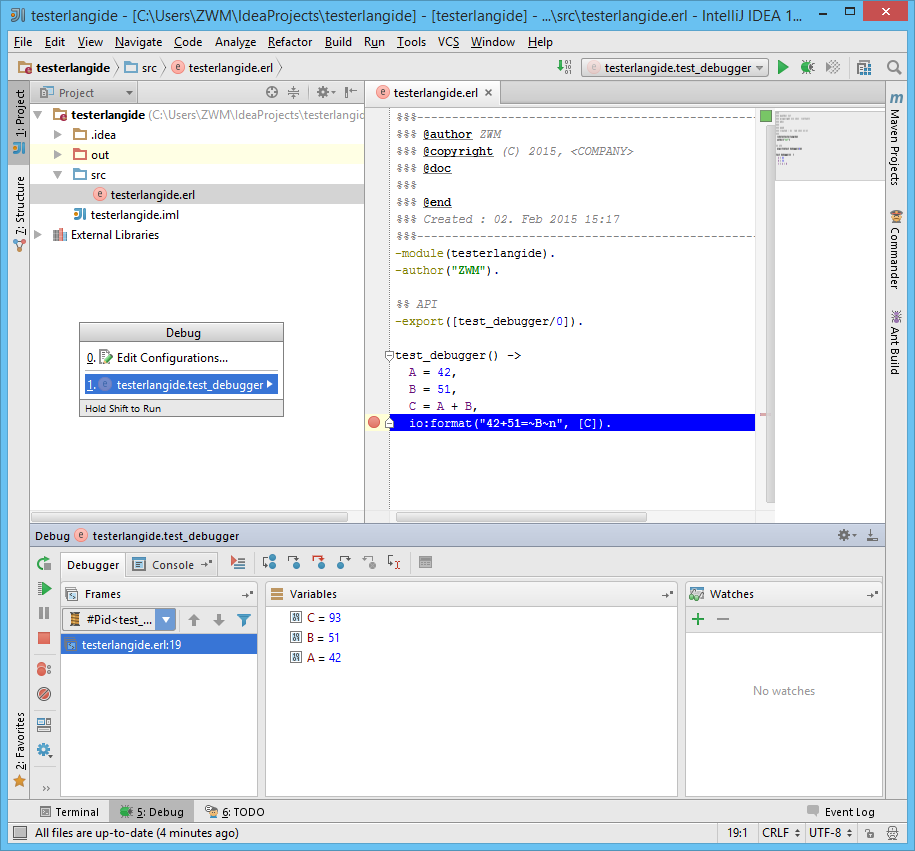
So far, so good.
Debugging standard OTP applications
Now let's try to debug something more serious, like an OTP application.
rebarcreate-app appid=testerlangide
==> testerlangide (create-app)
Writing src/testerlangide.app.src
Writing src/testerlangide_app.erl
Writing src/testerlangide_sup.erl
Let's create a gen_server which prints something every 5 seconds
...

-define(DELAY_BETWEEN_LOOKUPS, 5000).

-record(state, {timer}).

init([]) ->
  Timer = erlang:send_after(?DELAY_BETWEEN_LOOKUPS, self(), timer_ticked),
  {ok, #state{timer=Timer}}.

...

handle_info(timer_ticked, #state{timer=OldTimer}=State) ->
  erlang:cancel_timer(OldTimer),
  io:format("Tick!~n"),
  Timer = erlang:send_after(?DELAY_BETWEEN_LOOKUPS, self(), timer_ticked),
  {noreply, State#state{timer=Timer}};

...
I've tried debugging the application directly, by having the debugger directly start the application (application:start(testerlangide)), but it didn't work well:
- When "Stop Erlang interpreter automatically after execution" is ticked, the Erlang node is stopped directly after the app is started, which is obviously not good.
- When "Stop Erlang interpreter automatically after execution" is not ticked, the breakpoints in the gen_server do not work, because the node is considered by the IDE to be stopped. Thus you can't stop it, which is also not good.
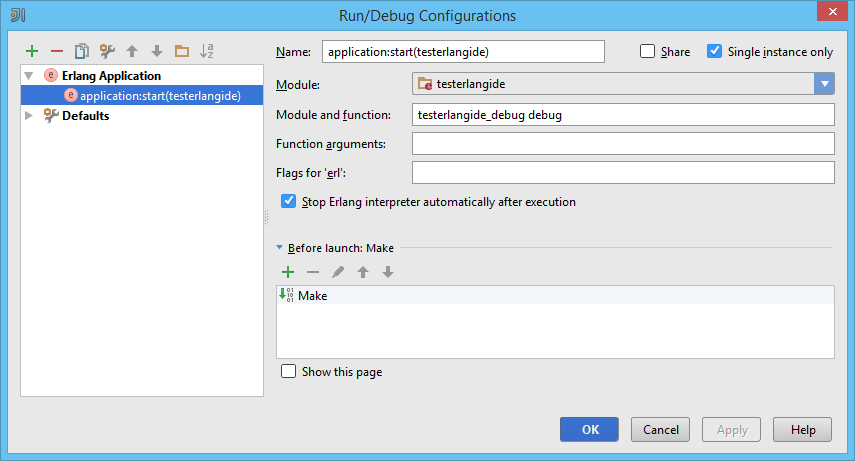
What I ended up doing was the creation of a "proxy" file, that starts the app, and does nothing until the node is stopped. That way, the breakpoints in the gen_servers work, and the node can be stopped by clicking on the red square button in the IDE.
-export([debug/0]).

loop_sleep() ->
  timer:sleep(5000),
  loop_sleep().

debug() ->
  %% Start your dependencies here
  application:start(testerlangide),
  loop_sleep().
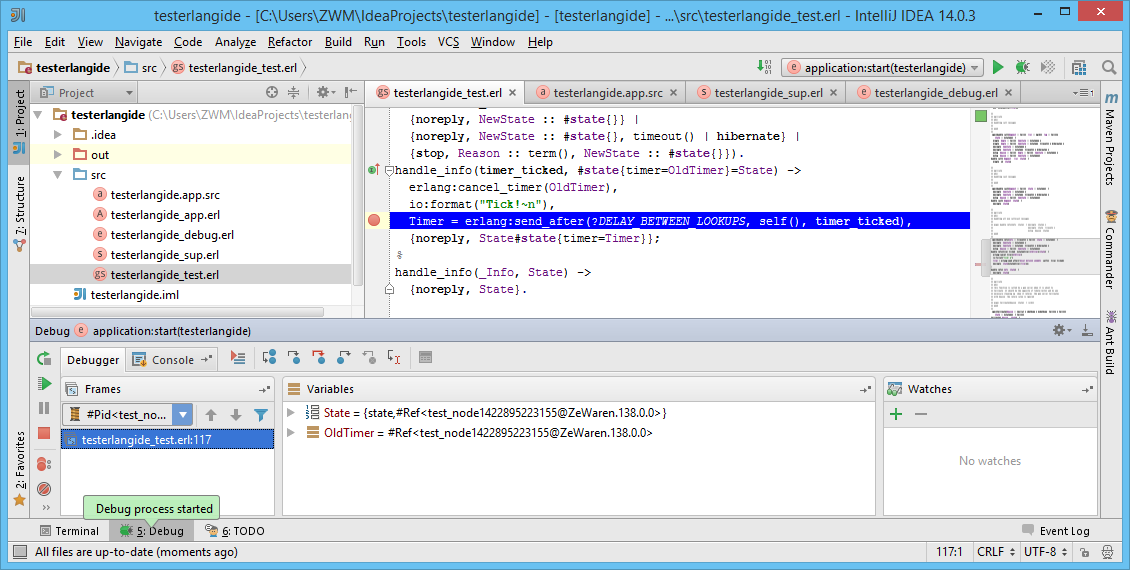
Debugging a remote node
Using Intellij on Windows works fine, but many Erlang libraries don't. In my opinion, Erlang is much more pleasant on UNIX systems. Still, that shouldn't prevent us from debugging.
Fortunately, the author of the plugin included a way to debug remote nodes. A local node will be spawned on the IDE's computer, connect to the target node, and fire up the debugger.
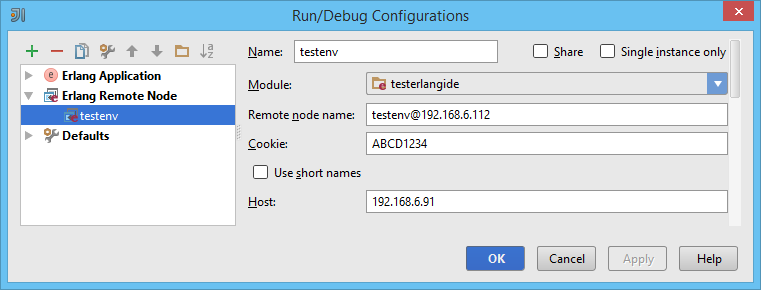
If your remote node is using long names, please be sure that your intellij-erlang include this commit and this commit. Otherwise, your local node won't be started with a correct name and debugging will fail.
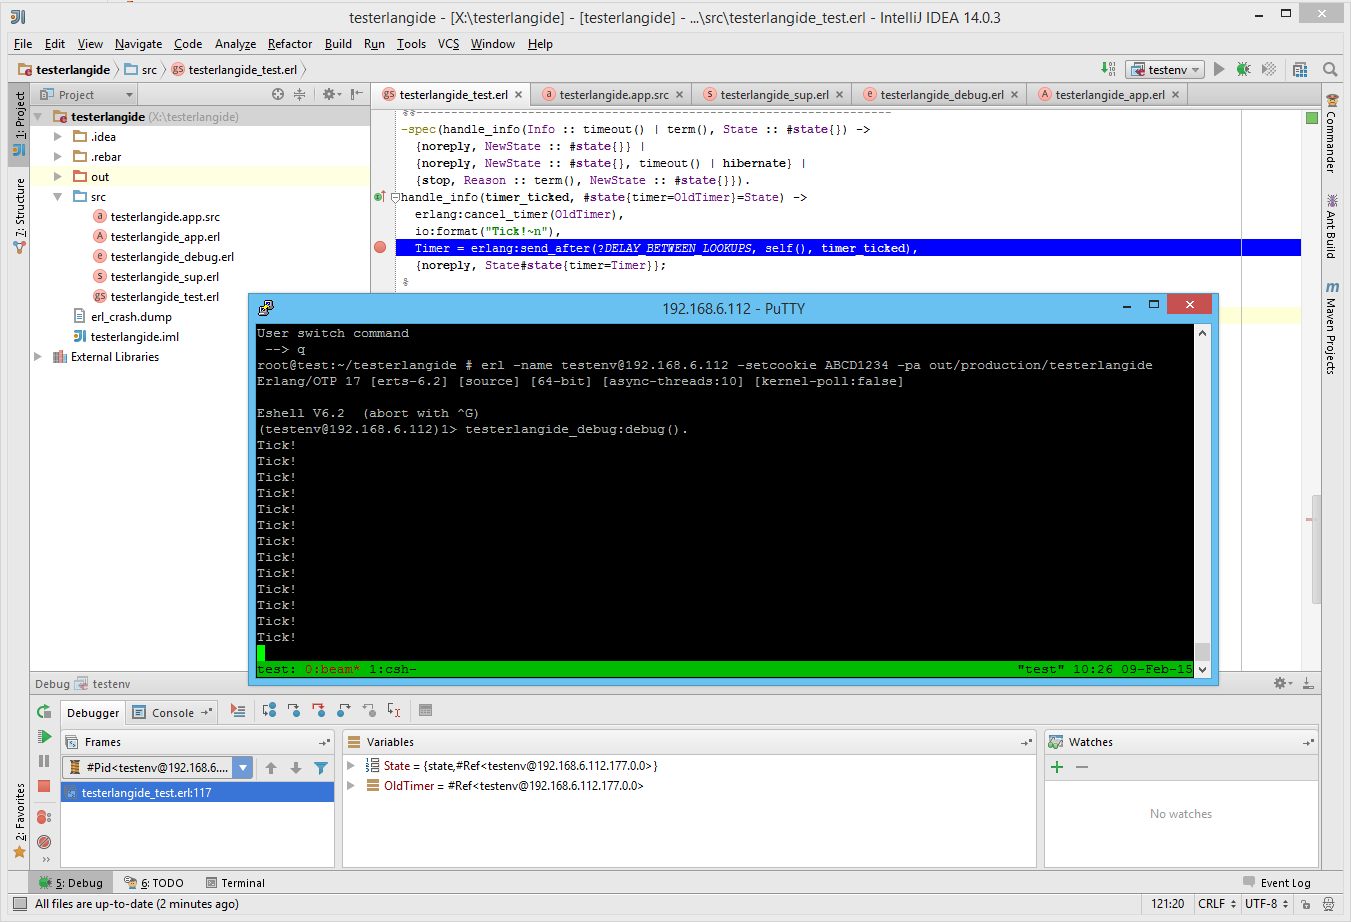
You can even connect to an already running system, debug a few lines, and let it live again normally. That's perfect to debug hard live problems.